Grade 10 Mathematics · Strand 3.0 Statistics and Probability · Sub-strand 3.1 Statistics I
These are free study notes for Grade 10 learners. They follow the official KICD curriculum design for Grade 10 Mathematics (the same topics, in the same order, that your teacher uses) and are taken from our full Grade 10 Mathematics notes. Statistics questions are long but predictable. Set out the frequency table neatly with every column labelled, and most of the marks follow.
Schools, hospitals, farmers and the government all make decisions from data: how many learners are late, which shoe size to stock, how much rain fell. Statistics is the science of collecting, organising, presenting and interpreting data. In this topic we build frequency tables, find the mean, median and mode, and draw histograms and frequency polygons.
Data and how it is collected
Statistics
The science of collecting, organising, presenting, analysing and interpreting data so that decisions can be made.
| Kind of data | What it is | Examples |
|---|---|---|
| Categorical | A quality or category | Favourite subject, type of transport |
| Discrete | Counted (whole numbers) | Number of siblings, goals, shoe size |
| Continuous | Measured (any value in a range) | Height, mass, time, rainfall |
| Source | Meaning | Examples |
|---|---|---|
| Primary | Collected by you | Survey, interview, measurement, experiment |
| Secondary | Already exists | School records, KNBS Economic Survey, weather reports |
Good practice
Ask clear questions, keep answers private, and record each answer honestly at once using tally marks (groups of five).
Frequency tables and grouping
Brothers and sisters of 20 learners
x = 0, 1, 2, 3, 4, 5 with frequencies f = 1, 4, 8, 4, 2, 1.
Check: 1 + 4 + 8 + 4 + 2 + 1 = 20.
Cumulative frequency (adding as you go down): 1, 5, 13, 17, 19, 20.
Grouped data
- Find the range (largest - smallest) and choose 5 to 10 classes of equal width.
- Classes must not overlap and must leave no gaps.
| Term | For the class 40-49 |
|---|---|
| Class limits | 40 and 49 |
| Class boundaries | 39.5 and 49.5 (halfway to the next class) |
| Class width | 49.5 - 39.5 = 10 |
| Midpoint | (40 + 49) ÷ 2 = 44.5 |
Mean, median and mode
| Average | Raw data | Frequency table |
|---|---|---|
| Mean | Sum of values ÷ number of values | Sum of fx ÷ sum of f (x = midpoint for grouped data) |
| Median | Middle value in order (mean of the two middle values if n is even) | Value at position (n + 1) ÷ 2, found from the cumulative frequency |
| Mode | Most frequent value | Value (or class) with the highest frequency |
Raw data: 4, 7, 5, 9, 7, 6, 8
Mean = 46 ÷ 7 = 6.57.
In order: 4, 5, 6, 7, 7, 8, 9. Median = 4th value = 7.
Mode = 7.
Mean of grouped data: marks of 40 learners
Classes 10-19 to 60-69 with f = 2, 5, 9, 14, 7, 3 and midpoints 14.5 to 64.5.
fx = 29, 122.5, 310.5, 623, 381.5, 193.5; sum of fx = 1,660.
Mean = 1,660 ÷ 40 = 41.5 marks (an estimate).
Mode and median of grouped data
- Mode = L + [d1 ÷ (d1 + d2)] × c, where L is the lower boundary of the modal class, d1 and d2 are its frequency minus the frequencies before and after it, and c is the class width.
- Median = L + [(n ÷ 2 - F) ÷ f] × c, where L is the lower boundary of the median class, F the cumulative frequency before it and f its frequency.
- For the 40 marks: mode = 39.5 + 5 ÷ 12 × 10 = 43.67; median = 39.5 + (20 - 16) ÷ 14 × 10 = 42.36.
Histograms and frequency polygons
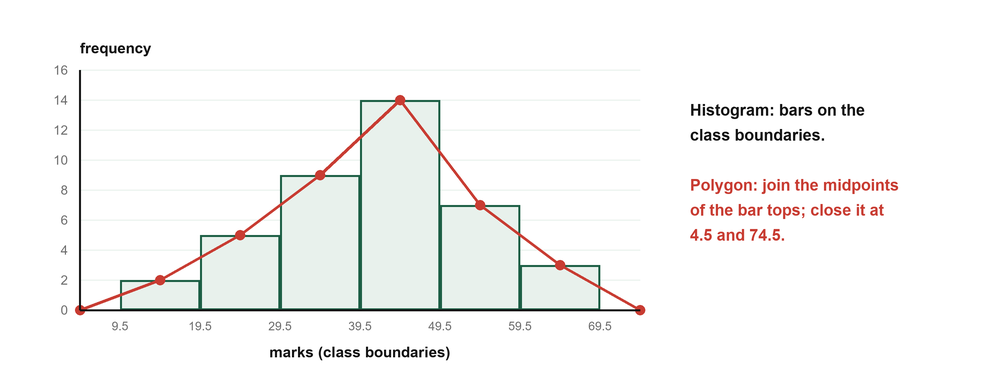
| Feature | Histogram | Bar chart |
|---|---|---|
| Data | Grouped continuous data | Separate categories |
| Bars | Touch, drawn on class boundaries | Have gaps between them |
| Bar size | Area shows frequency | Height shows frequency |
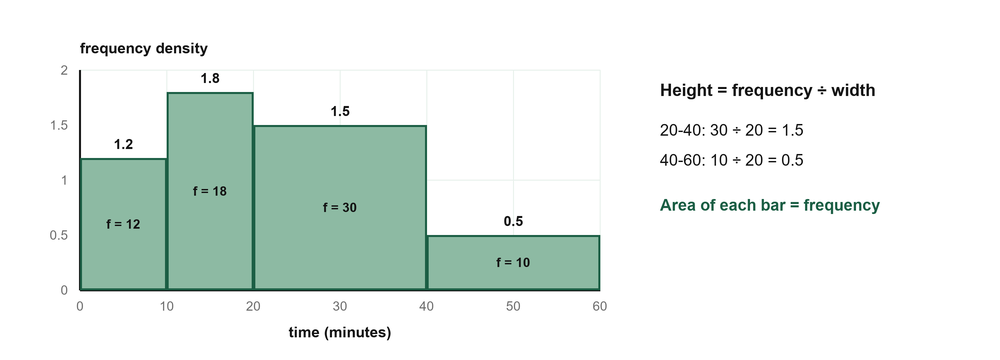
When class widths are unequal, the height of each bar is the frequency density = frequency ÷ class width, so that the area of the bar equals the frequency.
Drawing a frequency polygon
- Plot each frequency against its class midpoint.
- Join the points with straight lines.
- Close the polygon with an extra class of frequency 0 at each end.
Interpreting data and choosing an average
Reading the marks histogram
Pass mark 40: 14 + 7 + 3 = 24 learners passed, which is 24 ÷ 40 × 100 = 60 per cent.
The modal class is 40-49 and the graph is roughly symmetric.
The mean
Advantages
- Uses every value.
- Good for further calculation and for comparing groups.
Disadvantages
- Pulled by extreme values (outliers).
- May not be one of the actual values.
Why the median is better for pay
Monthly pay in KSh thousands: 20, 22, 25, 24, 23 and 150.
Mean = 264 ÷ 6 = 44 (KSh 44,000), but five of the six workers earn far less.
Median = (23 + 24) ÷ 2 = 23.5 (KSh 23,500), which describes the typical worker better.
Which average?
Use the median for skewed data such as income, the mode for the most common category (for example the shoe size a shop should stock most), and the mean when all values matter.
Key points to remember
- Data may be categorical, discrete or continuous, and primary or secondary.
- Grouped data use class limits, boundaries, widths and midpoints.
- Mean = sum of fx ÷ sum of f; median from the cumulative frequency; mode = most frequent.
- Histogram bars touch and their area shows frequency; with unequal widths, height = frequency ÷ width.
- A frequency polygon joins the midpoints of the bar tops and is closed at both ends.
Practice questions
Classify each as categorical, discrete or continuous: (a) the mass of a learner (b) the number of cows on a farm (c) the colour of a school bus. (3 marks)
Show the answer
(a) Continuous (b) discrete (c) categorical.
Find the mean, median and mode of: 6, 9, 4, 9, 12, 7, 10, 3. (3 marks)
Show the answer
- Mean = 60 ÷ 8 = 7.5.
- In order: 3, 4, 6, 7, 9, 9, 10, 12; median = (7 + 9) ÷ 2 = 8.
- Mode = 9.
The goals scored by a team in 20 matches were: 0 goals (3 matches), 1 (7), 2 (6), 3 (3), 4 (1). Find the mean, mode and median. (4 marks)
Show the answer
- Sum of fx = 0 + 7 + 12 + 9 + 4 = 32; mean = 32 ÷ 20 = 1.6.
- Mode = 1.
- Cumulative frequencies 3, 10, 16, ...: the 10th value is 1 and the 11th is 2, so the median = 1.5.
State the class boundaries, width and midpoint of the class 25-29. (3 marks)
Show the answer
Boundaries 24.5 and 29.5; width 5; midpoint 27.
The masses (kg) of 40 learners: 40-44 (4), 45-49 (9), 50-54 (15), 55-59 (8), 60-64 (4). Estimate the mean mass. (3 marks)
Show the answer
- Midpoints 42, 47, 52, 57, 62.
- fx = 168, 423, 780, 456, 248; sum = 2,075.
- Mean = 2,075 ÷ 40 = 51.875, about 51.88 kg.
For the masses in the question above, estimate the mode and the median. (4 marks)
Show the answer
- Modal class 50-54: mode = 49.5 + 6 ÷ (6 + 7) × 5 = 49.5 + 2.31 = 51.81 kg.
- Cumulative frequencies 4, 13, 28, ...: the 20th value is in 50-54.
- Median = 49.5 + (20 - 13) ÷ 15 × 5 = 49.5 + 2.33 = 51.83 kg.
Ages in a village survey: 0-10 (20 people), 10-15 (15), 15-20 (25), 20-40 (40). Find the height of each bar in a histogram. (4 marks)
Show the answer
Frequency densities: 20 ÷ 10 = 2; 15 ÷ 5 = 3; 25 ÷ 5 = 5; 40 ÷ 20 = 2.
Give one advantage of the median over the mean and say when it should be used. (2 marks)
Show the answer
It is not affected by extreme values, so it is better for skewed data such as salaries or house prices.
This is one topic. Get the whole year. The full Grade 10 Mathematics notes cover every sub-strand of Terms 1, 2 and 3 like this one, with pictures, key points and practice questions with answers, as a printable PDF for KSh 150. Pay with M-Pesa and download at once.
Get the full Grade 10 Mathematics notes · All Grade 10 Mathematics resources · Notes for every grade