Grade 8 Mathematics · Strand 4.0 Geometry · Sub-strand 4.2 Coordinates and Graphs
These are free study notes for Grade 8 learners. They follow the official KICD curriculum design for Grade 8 Mathematics (the same topics, in the same order, that your teacher uses) and are taken from our full Grade 8 Mathematics notes. Graph questions lose marks on small things: a missing axis label, an uneven scale, a point plotted the wrong way round. Use the checklist in the notes every time.
A map grid, a seating plan and a graph all locate things with two numbers. In this topic we draw the cartesian plane, read and plot points, make tables of values for linear equations, choose scales, draw straight-line graphs and solve simultaneous equations graphically.
The cartesian plane and coordinates
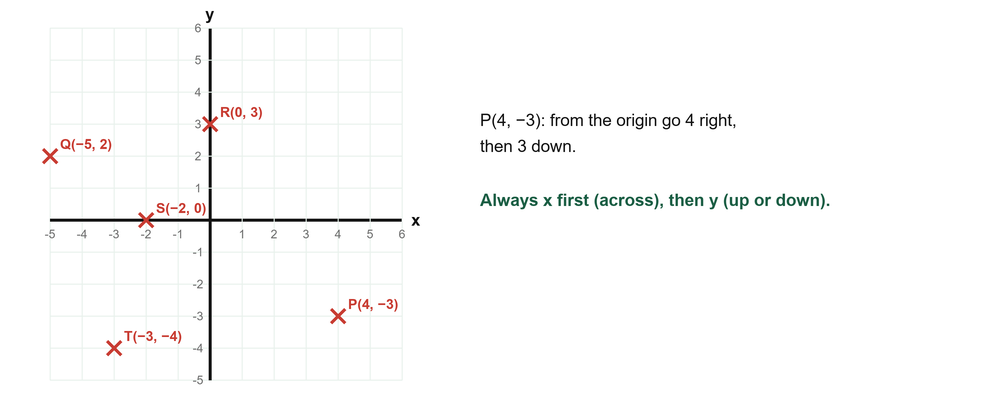
Draw a horizontal x-axis and a vertical y-axis crossing at the origin (0, 0), with equal steps: positive to the right and up, negative to the left and down. The axes divide the plane into four quadrants, numbered anticlockwise from the top right.
Reading and plotting
A is 3 right and 2 up: A(3, 2).
B is 4 left and 1 up: B(-4, 1). C is 2 left and 3 down: C(-2, -3).
To plot P(4, -3): go 4 right, then 3 down. A point on the x-axis has y = 0, e.g. (5, 0).
A square with vertices (0, 0), (3, 0) and (3, 3) has its fourth vertex at (0, 3).
Tables of values
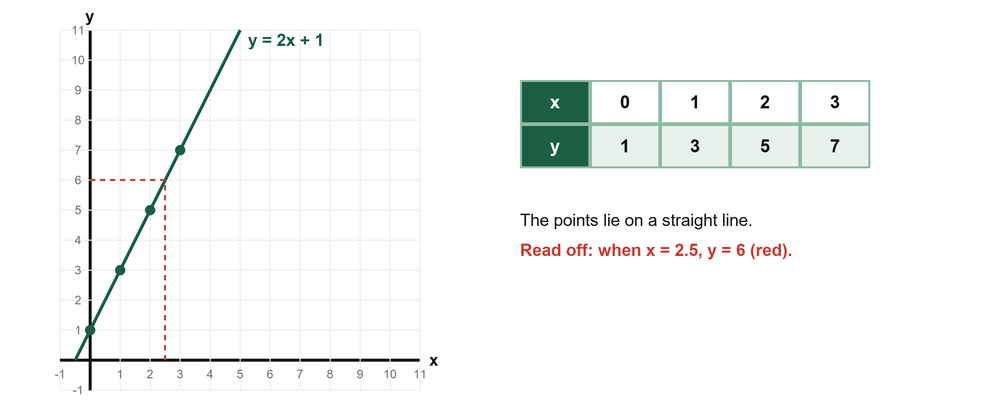
| x | -2 | -1 | 0 | 1 | 2 | 3 |
|---|---|---|---|---|---|---|
| y = 2x + 1 | -3 | -1 | 1 | 3 | 5 | 7 |
Lines of the form ax + by = c
x + y = 6: x = 0 gives y = 6; y = 0 gives x = 6; check (2, 4).
2x + 3y = 12: points (0, 4) and (6, 0); check (3, 2).
Using x = 0 and y = 0 gives where the line cuts the axes.
Scales and drawing the graph
- Find the largest and smallest values on each axis.
- Choose a scale that uses most of the paper; each axis must be even throughout, though the two axes may differ.
- Write the scale, e.g. "2 cm to 1 unit on the x-axis".
- Plot the points, join them with a ruler and label the line. Three points are enough; the third is a check.
Reading a graph: taxi fares
Cost = 50 × distance + 100: (0, 100), (2, 200), (4, 300), (6, 400).
From the graph: 5 km costs Ksh 350; Ksh 250 pays for 3 km.
Solving simultaneous equations graphically
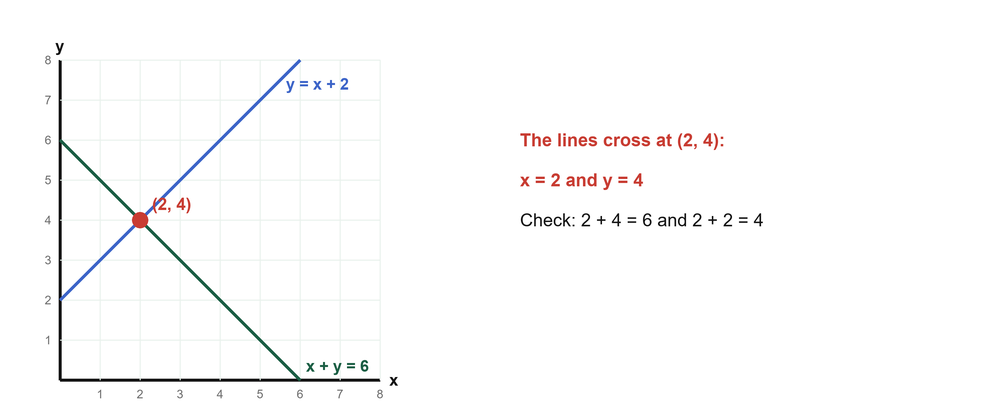
Solve x + y = 6 and y = x + 2
Line 1: (0, 6), (6, 0). Line 2: (0, 2), (2, 4), (4, 6).
They cross at (2, 4), so x = 2 and y = 4.
Check: 2 + 4 = 6 and 2 + 2 = 4.
Solve 2x + y = 7 and x - y = 2
Line 1: (0, 7), (3.5, 0), check (2, 3). Line 2: (0, -2), (2, 0), check (4, 2).
They meet at (3, 1). Check: 6 + 1 = 7 and 3 - 1 = 2.
Graphs in real life
Choosing a phone plan
Plan A: Ksh 200 a month plus Ksh 2 a minute: cost = 2m + 200.
Plan B: Ksh 6 a minute: cost = 6m.
The lines meet at 50 minutes, cost Ksh 300.
Below 50 minutes Plan B is cheaper; above 50 minutes Plan A is cheaper.
With IT
A spreadsheet or graphing app can draw y = 2x + 1 and x + y = 7; they meet at (2, 5).
Key points to remember
- Coordinates are written (x, y): across first, then up or down.
- Make a table of values by substituting x-values.
- Choose an even scale on each axis and label the line.
- A linear equation gives a straight line; three points are enough.
- Where two lines cross gives the solution of the simultaneous equations.
Test yourself: multiple choice
Which point lies on the y-axis?
Show the answer
B: On the y-axis x = 0.
For y = 3x - 2, what is y when x = -1?
Show the answer
A: 3 × (-1) - 2 = -5.
Where does the line 2x + 3y = 12 cut the x-axis?
Show the answer
D: y = 0 gives x = 6.
The lines x + y = 6 and y = x + 2 meet at
Show the answer
C: Both are true at x = 2, y = 4.
In which quadrant is the point (-3, -5)?
Show the answer
A: Both negative: third quadrant.
Practice questions
Copy and complete the table for y = 4 - x for x = -1, 0, 1, 2, 3. (2 marks)
Show the answer
y = 5, 4, 3, 2, 1.
Plot A(1, 2), B(5, 2) and C(5, 5). Find the fourth vertex D of rectangle ABCD. (2 marks)
Show the answer
D(1, 5).
Solve graphically: y = 2x - 1 and x + y = 5. (4 marks)
Show the answer
- Line 1: (0, -1), (1, 1), (2, 3)
- Line 2: (0, 5), (5, 0), (2, 3)
- They meet at (2, 3): x = 2, y = 3
- Check: 4 - 1 = 3 and 2 + 3 = 5
A taxi charges Ksh 100 plus Ksh 50 per km. Use the cost rule to find the cost of 7 km and the distance Ksh 600 pays for. (3 marks)
Show the answer
- Cost = 50 × 7 + 100 = Ksh 450
- Distance: (600 - 100) ÷ 50 = 10 km
This is one topic. Get the whole year. The full Grade 8 Mathematics notes cover every sub-strand of Terms 1, 2 and 3 like this one, with pictures, key points and practice questions with answers, as a printable PDF for KSh 150. Pay with M-Pesa and download at once.
Get the full Grade 8 Mathematics notes · All Grade 8 Mathematics resources · Notes for every grade