Grade 9 Social Studies · Strand 4.0 Natural and Historic Built Environments · Sub-strand 4.1 Topographical Maps
These are free study notes for Grade 9 learners. They follow the official KICD curriculum design for Grade 9 Social Studies (the same topics, in the same order, that your teacher uses) and are taken from our full Grade 9 Social Studies notes. Map work is skills, not memory. Keep a ruler and a pencil next to you and do every scale calculation yourself as you read.
A topographical map shows a small area in great detail: its hills, rivers, roads, farms, schools and towns. In this topic we read human activities from a topographical map, enlarge and reduce parts of a map, and draw cross-sections that show the shape of the land.
Revising topographical maps
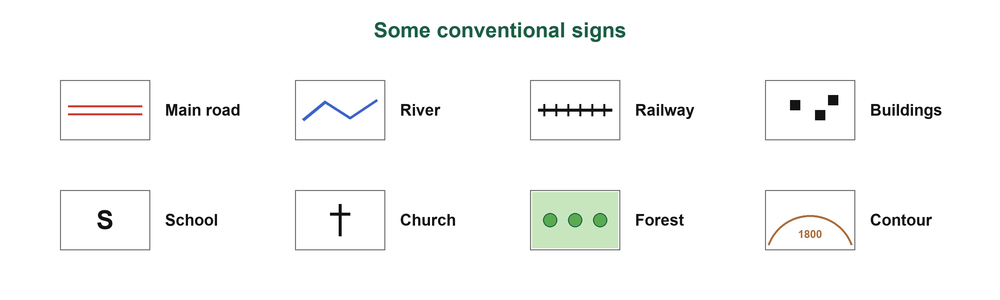
Topographical map
A large-scale map showing natural and human-made features of a small area, using conventional signs, contours and a grid.
Marginal information includes the title, scale (for example 1:50,000), key, north arrow, grid numbers, sheet number and publisher (Survey of Kenya).
Grid references
A six-figure grid reference gives the easting first, then the northing: "along the corridor, then up the stairs".
Human activities on topographical maps
| Activity | Evidence on the map |
|---|---|
| Farming | Plantations, cattle dips, tea or coffee factories |
| Trade | Markets, shops, towns |
| Transport | Roads, railways, airstrips |
| Forestry | Forests, sawmills |
| Mining | Quarries, mines |
| Fishing and tourism | Fish landing sites; hotels, camps, game parks |
| Social services | Schools, dispensaries, churches, mosques, chief's camps, police posts |
In the exam
Always pair an activity with its evidence, for example "Tea farming: tea factory at grid reference 456789."
| Settlement pattern | Where it is found |
|---|---|
| Nucleated | Clustered at a market or road junction |
| Linear | Along a road, railway or river |
| Dispersed | Scattered over farmland |
People settle where there is water, fertile soil, gentle slopes, roads and security; they avoid steep slopes, swamps, forests and game parks.
Enlarging and reducing a map
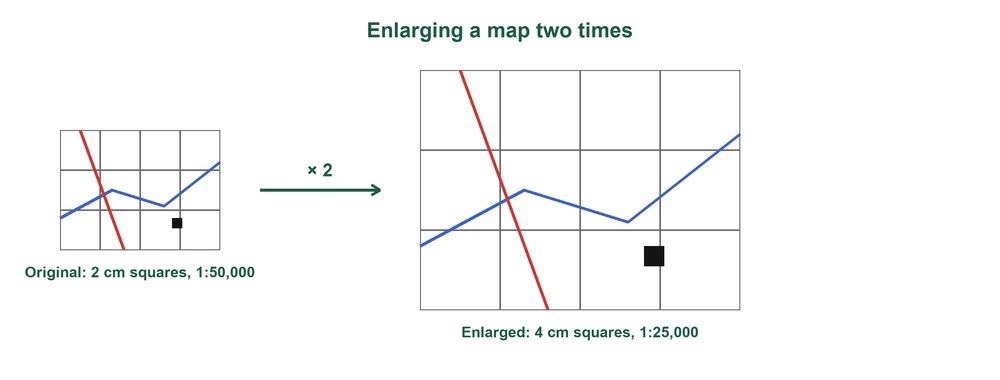
Enlarging part of a map two times
- Draw 2 cm squares over the area on the original map.
- Draw a new grid with 4 cm squares and the same number of squares.
- Copy the features square by square.
- Add a title, key, north arrow and the new scale.
Working out the new scale
Enlarging two times: 1:50,000 becomes 1:(50,000 ÷ 2) = 1:25,000.
Reducing by half: 1:50,000 becomes 1:(50,000 × 2) = 1:100,000.
A reduced map shows the same area in less space, but with less detail.
Drawing a cross-section
Cross-section
A side view showing the shape of the land along a line between two points.
From map to cross-section
- Join points A and B with a straight line; lay a paper strip along it.
- Mark where each contour crosses and write its height; mark rivers and roads.
- Draw a base line as long as the strip and a vertical scale (for example 1 cm to 20 m).
- Plot each height, join with a smooth curve and label title, A, B, features and scales.
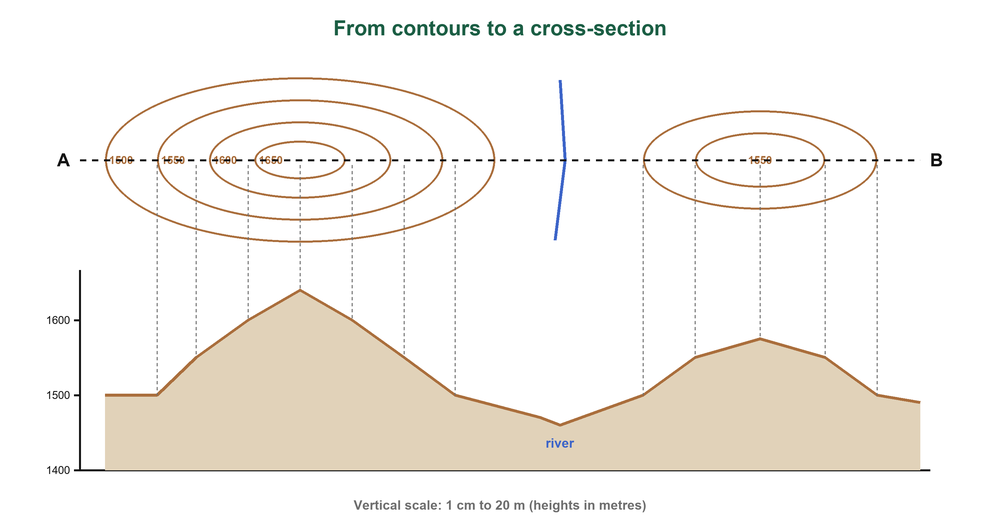
Vertical exaggeration
Horizontal scale 1:50,000; vertical scale 1 cm to 20 m = 1:2,000.
Vertical exaggeration = 50,000 ÷ 2,000 = 25.
Heights are stretched 25 times so the slopes can be seen.
Why topographical maps matter
- Planning roads, towns and dams, and placing schools, hospitals and markets fairly.
- Locating places; tourism and hiking.
- Land surveying and adjudication; military use.
- Studying relief and drainage, and planning for disasters.
Key points to remember
- Topographical maps use conventional signs, contours and grids to show a small area.
- Every human activity named from a map must be backed by map evidence.
- Settlement may be nucleated, linear or dispersed.
- Enlarging two times halves the scale number; reducing by half doubles it.
- Vertical exaggeration = horizontal scale number ÷ vertical scale number.
Test yourself: multiple choice
A map at 1:50,000 is enlarged two times. What is the new scale?
Show the answer
B: 50,000 ÷ 2 = 25,000.
Houses built in a line along a road show which settlement pattern?
Show the answer
A: Linear settlement follows a road or river.
Which map evidence shows tea farming?
Show the answer
C: Tea factories process tea grown nearby.
Horizontal scale 1:50,000 and vertical scale 1:2,000. The vertical exaggeration is
Show the answer
D: 50,000 ÷ 2,000 = 25.
In a six-figure grid reference, the first three figures give the
Show the answer
B: Easting comes first, then northing.
Practice questions
Name four economic activities that can be identified on a topographical map and give evidence for each. (8 marks)
Show the answer
- Farming: tea factory or cattle dip
- Trade: market or shops
- Transport: roads or railway
- Mining: quarry (also forestry: sawmill; tourism: hotel)
A map of scale 1:50,000 is reduced by half. State the new scale. (2 marks)
Show the answer
1:(50,000 × 2) = 1:100,000.
Outline four steps of drawing a cross-section from a topographical map. (4 marks)
Show the answer
- Join A and B and lay a paper strip along the line
- Mark contour crossings and heights
- Draw base line and vertical scale
- Plot heights, join smoothly and label
Give three uses of topographical maps. (3 marks)
Show the answer
Planning roads and towns; locating places; tourism; land surveying; military use; disaster planning (any three).
This is one topic. Get the whole year. The full Grade 9 Social Studies notes cover every sub-strand of Terms 1, 2 and 3 like this one, with pictures, key points and practice questions with answers, as a printable PDF for KSh 150. Pay with M-Pesa and download at once.
Get the full Grade 9 Social Studies notes · All Grade 9 Social Studies resources · Notes for every grade